Technical Services: Preparing Google Analytics Monthly Reports
Purpose: To provide step-by-step instructions for the monthly collection and assembly of usage statistics from Google Analytics
Step 1: Prepare working folder
- Before starting, create a new folder on your computer desktop
- Name this “working folder” with the month and year in the following format: 32018 (No leading zero)
Step 2: Login to Google Analytics
- Go to https://analytics.google.com/
- Login username & password
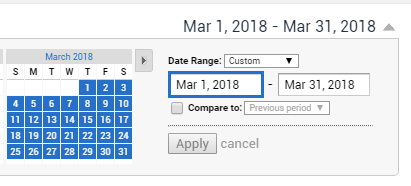
- Set date range from the first of the month to the last day of the month for which you are collecting statistics
- Click apply
Step 3: Access reports
- Click on “Customization” in sidebar menu
- Click on “Saved Reports” link
- Change “Show Rows” to 25 lines
- Click on “Name” column heading to arrange reports in alpha order
Step 4: Download reports
Google analytic reports are saved in pdf format utilizing the same naming format each month in order to facilitate consistency and increase ease and accuracy in uploading content on Library16 where staff may access the materials.
- Click on the name of the first report in the list
- Double check the desired date range has been retained
- Confirm that the “Show rows” option at the bottom of the page shows all the lines of data you want to export to pdf
- At the top of the page, click “Export”
- Select PDF format
- In the “Save As” dialog box, navigate to the working folder created in Step 1
- Name the file using the report name preceded by the month and year and an underscore. Use leading zeros for months 1-9.
The completed list of exported reports will include the following [with example date]:
032018_BrowserOS.pdf
032018_Dashboard.pdf (see below)
032018_DeviceOverview.pdf
032018_DepthofVisit.pdf
032018_EventsPagesBehavior.pdf (see below)
032018_FrequencyRecency.pdf
032018_GoogleAnalyticsReport.pdf (see below)
032018_Keywords.pdf
032018_LibGuides.pdf (see below)
032018_MobileDevices.pdf
032018_NewReturning.pdf
032018_ReferralTraffic.pdf
032018_SocialNetworks.pdf (see below)
032018_TopContent.pdf (set Primary Dimension to Page Title)
032018_TopExitPages.pdf
032018_TopLandingPages.pdf
032018_TrafficSources.pdf
032018_VisitDuration.pdf
032018_VisitorLoyalty.pdf
032018_VisitorOverview.pdf
- Click Save
- Click Back button in browser to return to list of Saved Reports
- Follow the same steps for all reports, unless otherwise noted under “see below” links
- Click Dashboard in the sidebar menu
- Click My Dashboard
- Confirm the date range has been retained
- Click Export
- Select PDF format
- Navigate to working file
- Name file using naming convention described above and save
- Click Event Pages (Behavior) link from the Saved Reports page
- Confirm the report date range has been retained
- Set Explorer at “Event”
- Export PDF with temporary file name (Example 1, 2, 3 …)
- Set Explorer at “Site Usage”
- Export PDF with temporary file name (Example 1, 2, 3 …)
- Assemble final report (see directions below)
- Delete temporary files
- Click Social Network Referrals
- Click Export
- Select PDF format
- Navigate to the working folder and export pdf with temporary file name (Example 1, 2, 3 …)
- Click the first social media link
- Adjust Show Rows to display the required
- Repeat the steps to Export the report for each social media site
- Assemble final report (see directions below)
- Delete temporary files
- Go to https://umaine.libapps.com/libapps/login.php?site_id=2084
- Login email & password
- Select All Guides
- Select Published
- Select Daily
- Set date range to match the desired month
- Click Run Report
- Select 100 records per page below the list of Guide Names
- Click the sandwich menu within the chart diagram

- Select “Download PDF,” saving it with a temporary name in your working folder
- Download the pages of the report that includes the data you are seeking, using temporary names (Example 1, 2, 3 …)
- Open Acrobat Pro
- Click “Combine Files into PDF”
- Import the series of reports with the chart as page 1
- Click “Combine Files”
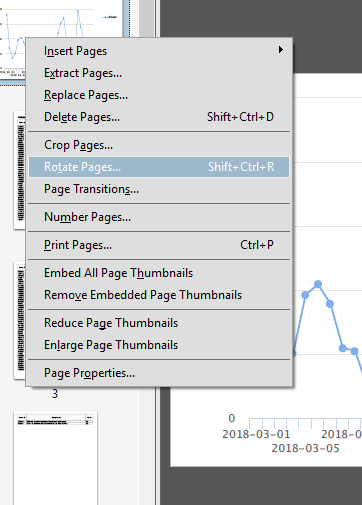
- Open the Page Thumbnail view in Acrobat Pro
- Right-click on the chart thumbnail
- Select “Rotate Pages”
- Using the established naming convention to name the final, compiled file
- Set Direction to “Counterclockwise 90 degrees”
- Click “Pages 1 to 1”
- Click “OK”
- Navigate to working folder
- Name file using naming convention described above
- Click “Save”
- Delete temporary files
- Open Acrobat Pro
- Click “Combine Files into PDF”
- Select all the completed, final reports inside the working folder
- Complete assembly of report (see directions below)
- Open Acrobat Pro
- Click “Combine Files into PDF”
- Import desired temporary files in the appropriate order
- Click “Combine Files”
- Using the established naming convention above, to name the final, assembled file
- Click “Save” and navigate to the working folder
- Name file using naming convention described above
- Delete temporary files
Go to Publishing Google Analytics Monthly Reports.
Return to Technical Services Table of Contents.
Contact: um.library.technical.services@maine.edu